Spring Cloud 因 Metrics 采集数据剧增导致CPU负载过高问题排查

原创文章,如需转载,请注明来自:https://bigzuo.github.io/

关键词:GC Overhead Limit Reached、CPU burst、Spring boot metrics

公司在基于 Spring Cloud 框架的微服务改造过程中,遇到如下问题:当把之前稳定运行在 Spring 3 框架上的业务代码迁移到 Spring Cloud 框架上之后,系统在运行几天后,CPU 的使用率会逐渐增加, GC 频率也会越来越快,最后 CPU 使用率接近100%,GC 每秒钟至少回收超过1G 的新生代对象,系统响应也变的非常慢。
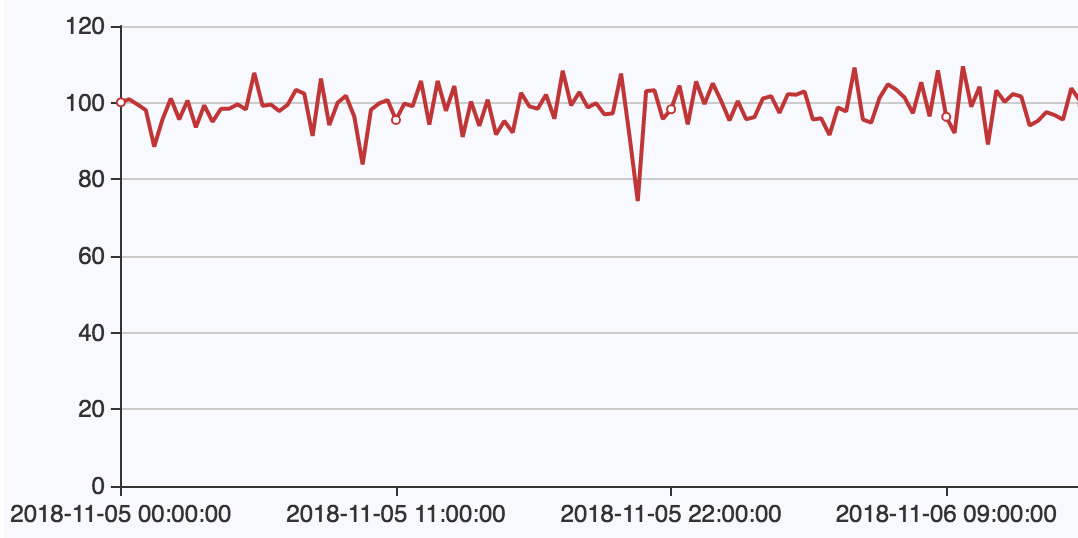
系统异常时 CPU 的使用率:

如下是对应的 GC 的回收日志:

1
2
3
4
5
6
7
8
9
10
11
2018-11-06T13:08:07.050+0800: 651403.763: [GC (Allocation Failure) [ParNew: 629120K->69888K(629120K), 0.2756745 secs] 1597577K->1071507K(2027264K), 0.2760656 secs][Times: user=0.42 sys=0.04, real=0.27 secs]
2018-11-06T13:08:07.770+0800: 651404.482: [GC (Allocation Failure) [ParNew: 629120K->69888K(629120K), 0.2476014 secs] 1630739K->1100519K(2027264K), 0.2480654 secs][Times: user=0.44 sys=0.02, real=0.25 secs]
2018-11-06T13:08:08.254+0800: 651404.966: [GC (Allocation Failure) [ParNew: 629120K->69888K(629120K), 0.2751807 secs] 1659751K->1131774K(2027264K), 0.2756036 secs][Times: user=0.43 sys=0.00, real=0.28 secs]
2018-11-06T13:08:08.766+0800: 651405.479: [GC (Allocation Failure) [ParNew: 629120K->63352K(629120K), 0.2730796 secs] 1691006K->1157311K(2027264K), 0.2734746 secs][Times: user=0.43 sys=0.00, real=0.27 secs]
2018-11-06T13:08:09.339+0800: 651406.052: [GC (Allocation Failure) [ParNew: 622584K->69888K(629120K), 0.2145773 secs] 1716543K->1191958K(2027264K), 0.2150520 secs][Times: user=0.39 sys=0.02, real=0.21 secs]
2018-11-06T13:08:09.840+0800: 651406.553: [GC (Allocation Failure) [ParNew: 629120K->69888K(629120K), 0.2307629 secs] 1751190K->1220217K(2027264K), 0.2312066 secs][Times: user=0.44 sys=0.01, real=0.23 secs]
2018-11-06T13:08:10.348+0800: 651407.061: [GC (Allocation Failure) [ParNew: 629120K->61099K(629120K), 0.2315866 secs] 1779449K->1242618K(2027264K), 0.2320276 secs][Times: user=0.45 sys=0.00, real=0.23 secs]
2018-11-06T13:08:10.846+0800: 651407.559: [GC (Allocation Failure) [ParNew: 620331K->69888K(629120K), 0.2436952 secs] 1801850K->1280069K(2027264K), 0.2441569 secs][Times: user=0.46 sys=0.01, real=0.25 secs]
2018-11-06T13:08:11.347+0800: 651408.060: [GC (Allocation Failure) [ParNew: 629120K->69888K(629120K), 0.2557926 secs] 1839301K->1308565K(2027264K), 0.2561927 secs][Times: user=0.45 sys=0.00, real=0.25 secs]
2018-11-06T13:08:11.965+0800: 651408.677: [GC (Allocation Failure) [ParNew: 629120K->69888K(629120K), 0.2906041 secs] 1867797K->1340506K(2027264K), 0.2909897 secs][Times: user=0.44 sys=0.01, real=0.29 secs]
2018-11-06T13:08:12.639+0800: 651409.351: [GC (Allocation Failure) [ParNew: 629120K->69888K(629120K), 0.2367491 secs] 1899738K->1372312K(2027264K), 0.2371123 secs][Times: user=0.45 sys=0.01, real=0.23 secs]

我们首先打印了系统的线程堆栈,但是并未发现任何异常。后来我们直接关掉了所有的访问流量,但是系统的异常情况依然持续。由于系统本身没有异步任务,所以基本排除是业务代码的问题,并且这些代码也在 Spring 3 框架上正常运行了超过了半年时间。

Java VisualVM 分析系统的 Jvm 内存 dump 信息如下:

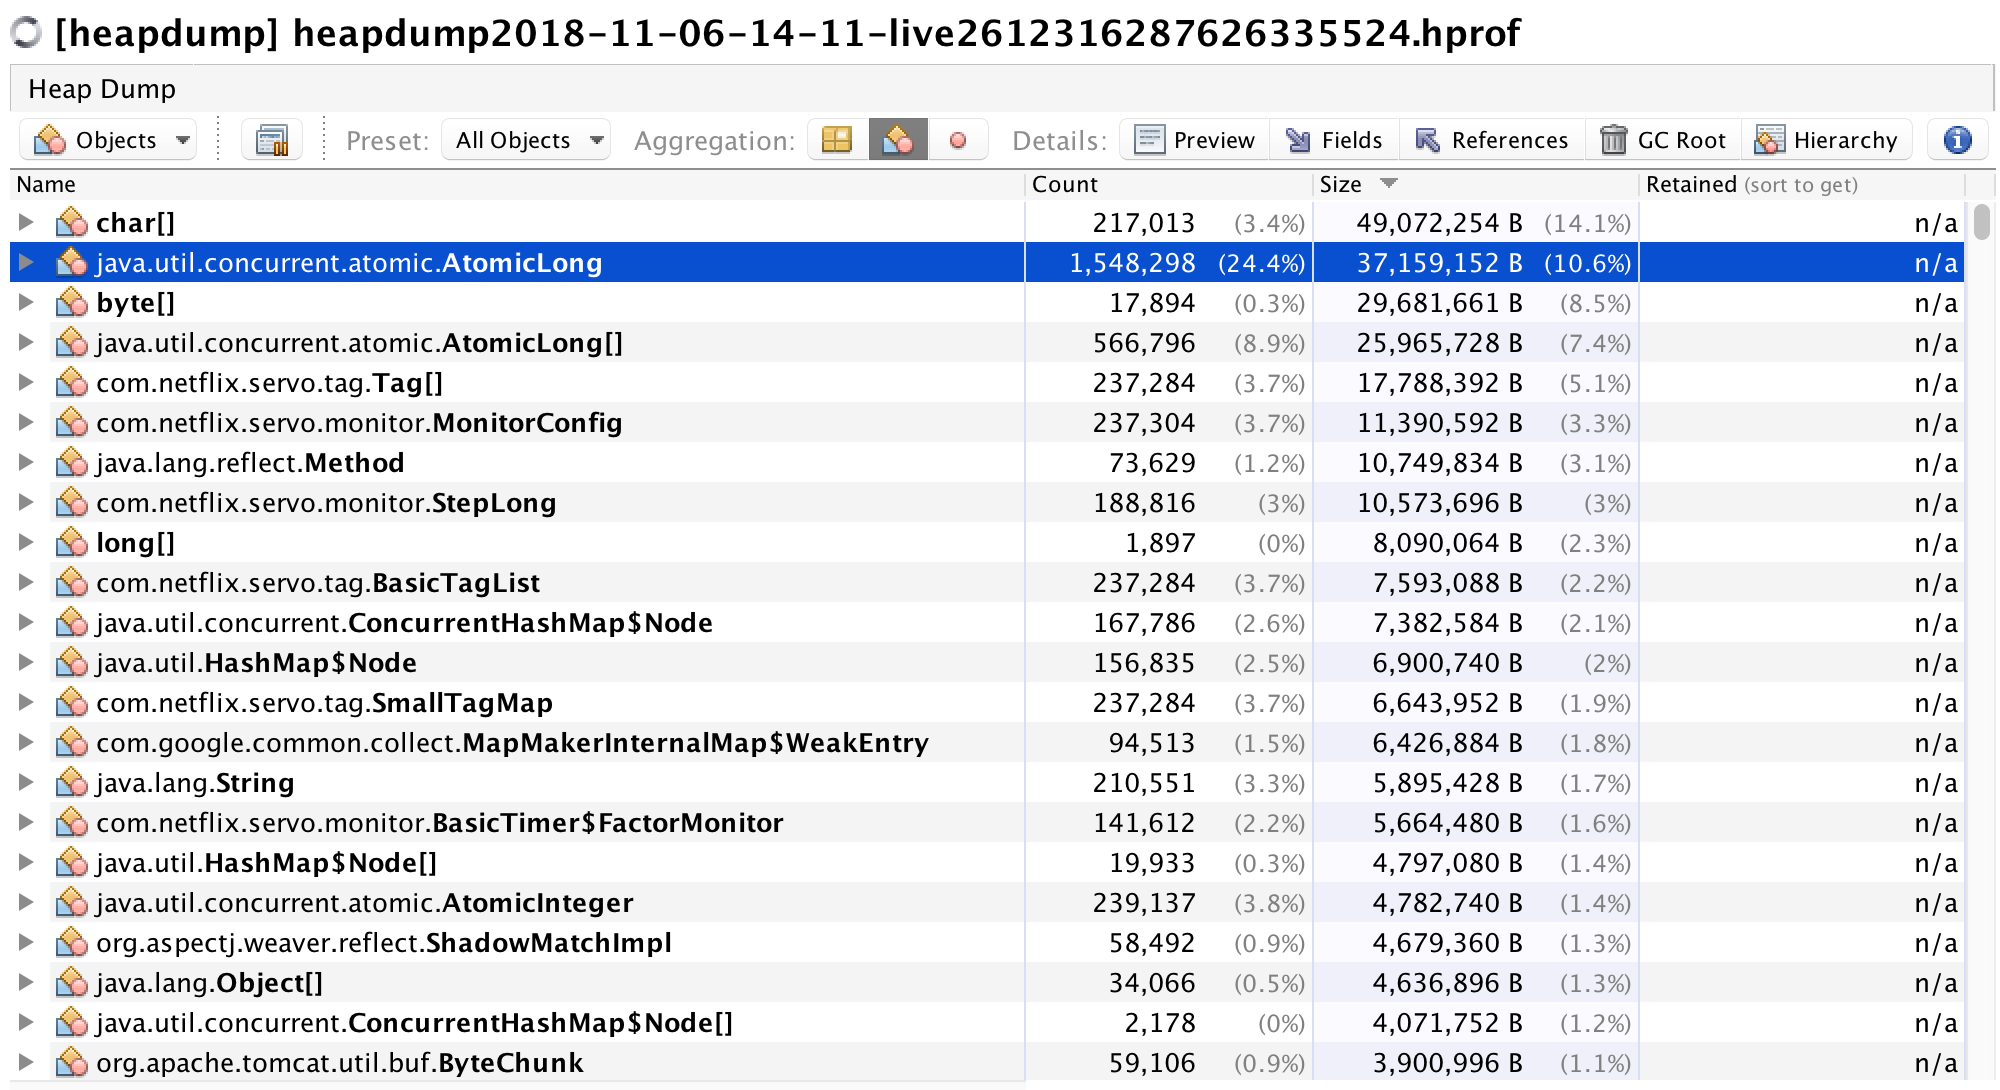
我们发现内存中数量最多的对象是AtomicLong,实例数量超过150万,达到堆空间中实例总数的24.4%,占了10.6%的空间。

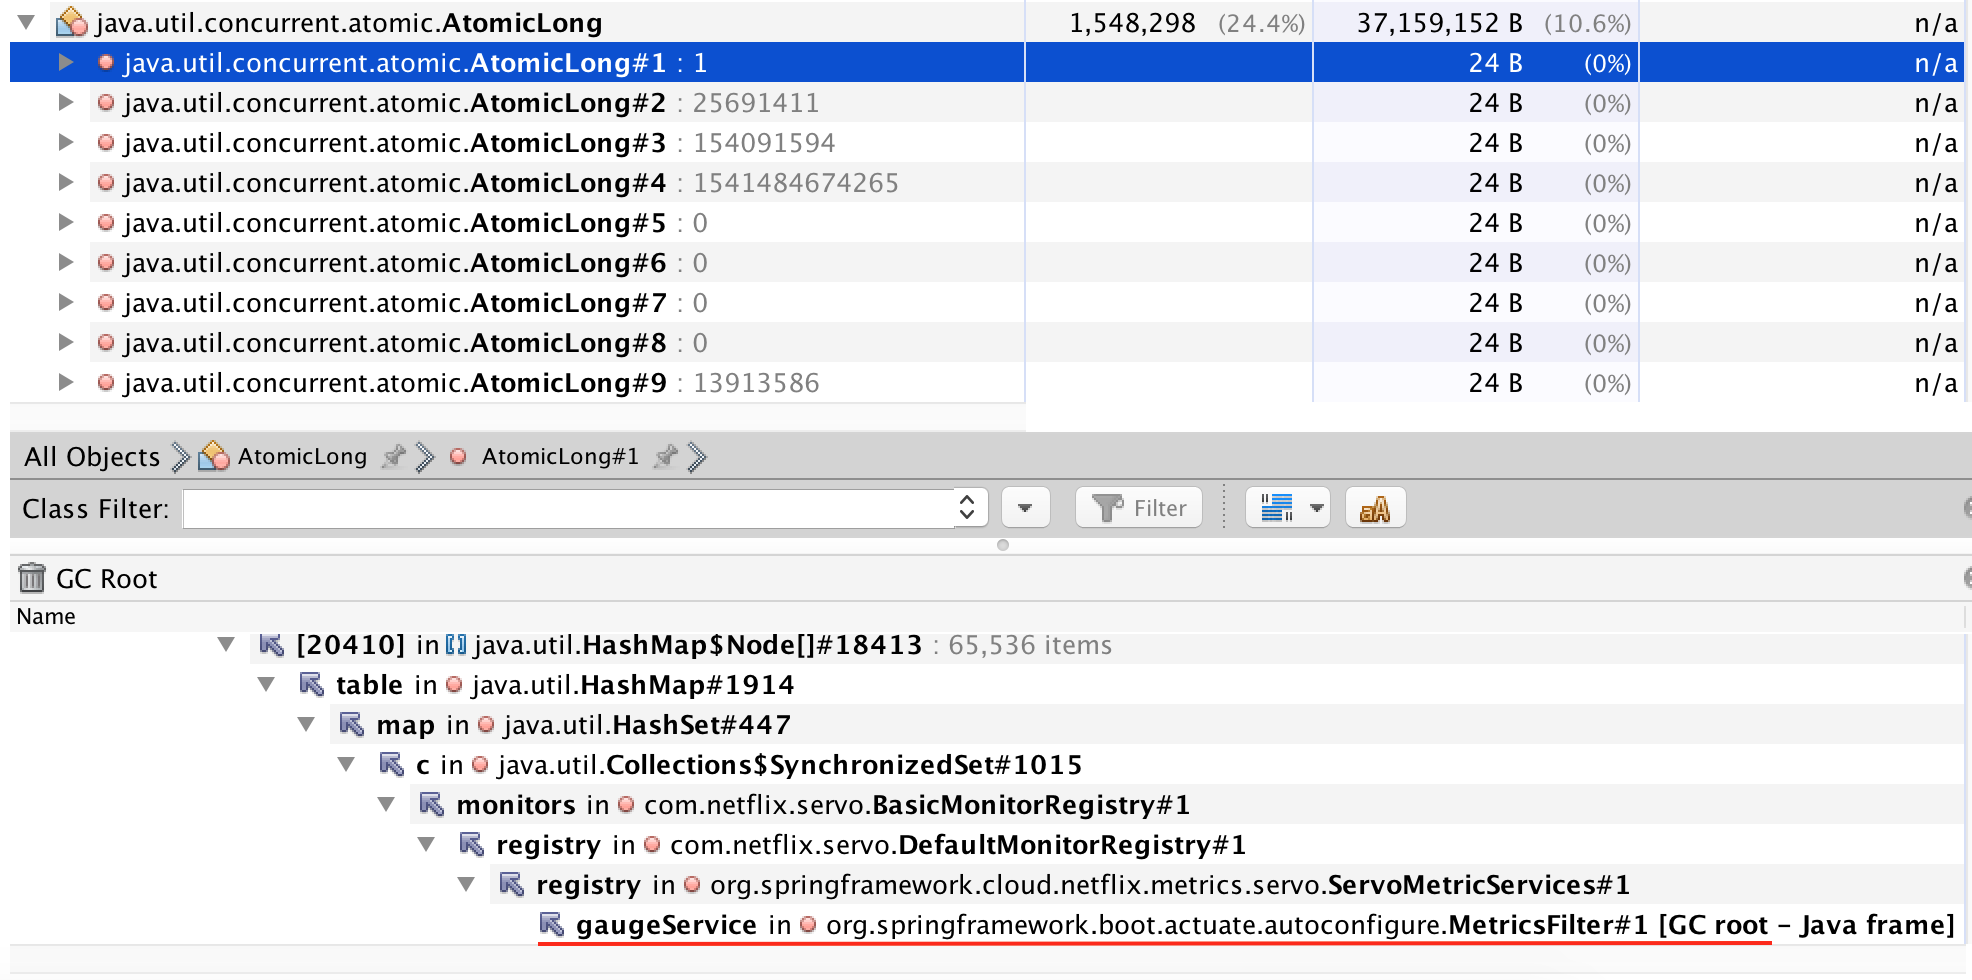
继续往下追踪,发现这些对象关联的 GC Root 都是是org.springframework.boot.actuate.autoconfigure.MetricsFilter 对象,而这个对象的功能是 Spring boot actuator 组件中用于收集 Web 请求产生的 Metric 统计数据,如HTTP 状态码、执行时间等。

现在基本确认,系统的异常应该和 Actuator 组件收集 Metric 统计数据有关。但是,在关掉系统所有流量后,异常状态依然持续,这又是为什么呢?

我们在 Spring Cloud Dalston.SR5 版本的官方文档中发现如下内容:

Without any additional dependencies or configuration, a Spring Cloud based service will autoconfigure a Servo MonitorRegistry and begin collecting metrics on every Spring MVC request.By default, a Servo timer with the name rest will be recorded for each MVC request which is tagged with:

  1. HTTP method

  2. HTTP status (e.g. 200, 400, 500)

  3. URI (or “root” if the URI is empty), sanitized for Atlas

  4. The exception class name, if the request handler threw an exception

  5. The caller, if a request header with a key matching netflix.metrics.rest.callerHeader is set on the request. There is no default key for netflix.metrics.rest.callerHeader. You must add it to your application properties if you wish to collect caller information.

… …

Avoid using hardcoded url parameters within RestTemplate. When targeting dynamic endpoints use URL variables. This will avoid potential “GC Overhead Limit Reached” issues where ServoMonitorCache treats each url as a unique key.

1
2
3
4
5
6
// recommended
String orderid = "1";
restTemplate.getForObject("http://testeurekabrixtonclient/orders/{orderid}", String.class, orderid)

// avoid
restTemplate.getForObject("http://testeurekabrixtonclient/orders/1", String.class)

上述内容大意是:在没有增加特殊的依赖或者配置的情况下,Spring Cloud 应用汇自动配置一个Servo MonitorRegistry 用来收集每次 Spring MVC 请求的 Metric 信息,如 HTTP 方法名、状态码、URL 名称等信息。不要在 RestTemplate Api 中对 Url 的参数进行硬编码,否则可能会引起 “GC Overhead Limit Reached” 异常,因为ServoMonitorCache会认为每个带参数的 Url 都是一个独立的 key,所以 Url 中的参数有多少个不同的值,就会产生多少个 key,进而导致内存使用大量增加,触发 GC 异常。而每个 key 的 value 都记录着这个 URL 的Metric 数据,所以 key 只要产生就会一直存在,因此就算完全没有请求进来,Actuator 组件依然会每次都遍历所有的 key,统计对应 key 的 Metric 信息,故而 “GC Overhead Limit Reached” 异常会一直存在。

根据这个分析,我们在应用代码中发现如下代码片段:

1
2
3
4
5
6
7
long timestamp = System.currentTimeMillis();
StringBuffer getParam = new StringBuffer("?");
getParam.append("empno").append("=").append(empNo).append("&");
getParam.append("timestamp").append("=").append(timestamp).append("&");
getParam.append("sign").append("=").append(URLEncoder.encode(sign(empNo + timestamp),"UTF-8"));
log.info("SalesService getEncryptIdByEmpNo("+empNo+") param:"+getParam.toString());
String resultStr = restTemplate.getForObject(getEncryptIdUrl+getParam.toString(), String.class); // restTemplate 调用,且 URL 中带有参数,并且基本每次调用参数都不一样

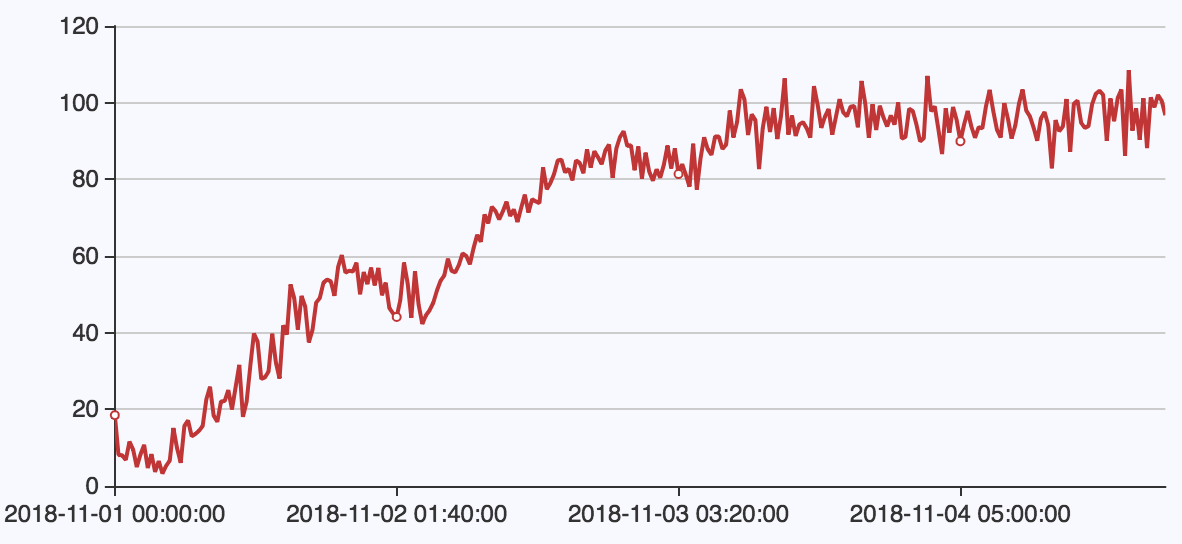
如果是这个原因引起的异常,那应用的表现应该是刚开始运行正常,随着这段代码的执行, GC 回收应该会越来越频繁,CPU 的使用率也会越来越高,基本应该和时间增加成正相关。查询了这个应用最近一段时间的 CPU 使用率情况变化,发现和猜测完全吻合:

问题定位后,我们通过优化应用代码解决了问题。当然,也可以通过关闭如下开关,避免收集 Spring Cloud 应用 Web 请求相关的 Metric 数据,也可以解决问题:

1
spring.autoconfigure.exclude = org.springframework.boot.actuate.autoconfigure.MetricFilterAutoConfiguration

或:

1
spring.metrics.servo.enabled=false

参考资料

MetricsFilter may create an unbounded number of metrics for requests with a templated URI that are not handled by Spring MVC

Log warning when ServoMonitorCache reaches certain configurable size

Decouple MetricsFilter from Spring MVC

ServoMonitorCache and GC Overhead Limit Reached: Added documentation/heads up accordingly

Ninjas’ guide to getting started with VisualVM

Spring Boot Web 应用性能优化